
I’ve started using InfluxDB for storing my sensor data as time series. The main reason for this is that it allows me to use Grafana for analyzing the data. This blog post is an introduction to my setup with these tools on a Raspberry Pi.
Introduction
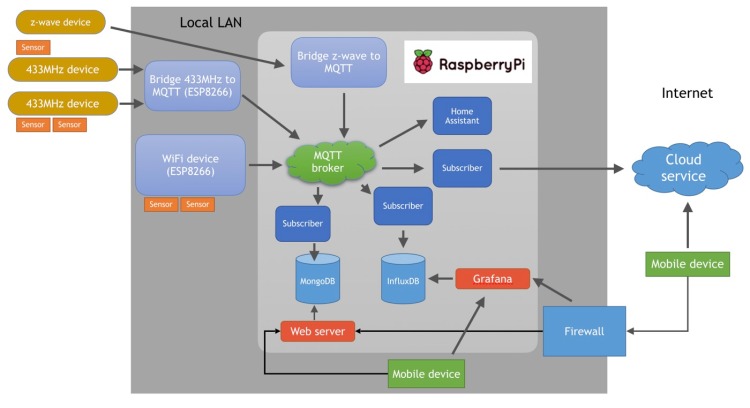
All sensor data in my IoT-home setup are transformed to MQTT messages that are published to a self-hosted MQTT broker (mosquitto). I have different services that subscribes to the MQTT topics:
- HomeAssistant. Stores changes of measurements as events. Displays the data and creates automation based on changes in the data.
- A subscriber for MongoDB. Stores all data in a MongoDB database. Used for a home made graph app that probably will be redundant with InfluxDB and Grafana in place.
- A proxy for Adafruit IO. Transforms a subset of the messages to Adafruit IO feeds and publishes them to an external cloud service.
To get data for a data source in Grafana, I simply add an additional MQTT subscriber that stores all messages in time series in an InfluxDB database. My setup will look like this:
An alternative solution for InfluxDB and Grafana is to let HomeAssistant export all state changes to InfluxDB:
https://home-assistant.io/components/influxdb/
I prefer not to use this approach as I don’t want HomeAssistant to be the central hub in my system. I really like HomeAssistant, but I want it to be a subscriber node that no other node has to depend on.
InfluxDB
InfluxDB is a time series database. It is optimized for queries in the time domain, e.g. for graphs with data points measured at different points in time. The database contains named “measurements”, e.g. “temperature_from_sensor_1”, and each measurement contains a set of data points that represents samples of the sensor data. A datapoint has a measurement name, a time stamp and a value. An additional set of values and arbitrary key-value tags can be attached to a datapoint (I don’t use this feature in my setup though).
Creating and using a database with measurement, value and time can look like this:
This file contains bidirectional Unicode text that may be interpreted or compiled differently than what appears below. To review, open the file in an editor that reveals hidden Unicode characters.
Learn more about bidirectional Unicode characters
| $ influx -precision rfc3339 // starts the InfluxDB shell and shows time in rfc3339 format | |
| Connected to http://localhost:8086 version 1.2.0 | |
| InfluxDB shell version: 1.2.0 | |
| > create database demo // Creates a new database | |
| > use demo | |
| Using database demo | |
| > insert mysensor1 value=0.51 // Insert new datapoints | |
| > insert mysensor1 value=0.53 // for the measurement | |
| > insert mysensor1 value=0.45 // "mysensor1" | |
| > select * from mysensor1 // Get the whole time series | |
| name: mysensor1 | |
| time value | |
| —- —– | |
| 2017-02-26T13:33:49.00279827Z 0.51 | |
| 2017-02-26T13:33:53.045762633Z 0.53 | |
| 2017-02-26T13:33:57.015427575Z 0.45 |
If a time stamp is not provided in the insert statement, InfluxDB will create one from the current time. The time stamps are UTC-based so you have to convert to local time when viewing your data. And if inserting time stamps manually, time should be in UTC.
InfluxDB has a HTTP API that can be used for queries. This is what Grafana uses.
Grafana
Grafana is a web-based data visualizing tool that can connect to InfluxDB and several other data sources. With Grafana, you can setup custom dashboards, alerts and notifications and you can zoom in- and out of the data sets. Grafana has a web front end that is very responsive and cool looking. It’s open-source and easy to use and self-host. I’m really impressed with this application.
Installation & setup
InfluxDB
For an installation of InfluxDB on a Raspberry Pi with Raspbian (stretch version), you need to add an additional apt-source:
This file contains bidirectional Unicode text that may be interpreted or compiled differently than what appears below. To review, open the file in an editor that reveals hidden Unicode characters.
Learn more about bidirectional Unicode characters
| sudo apt-get update | |
| sudo apt-get upgrade | |
| curl -sL https://repos.influxdata.com/influxdb.key | sudo apt-key add – | |
| echo "deb https://repos.influxdata.com/debian stretch stable" | sudo tee /etc/apt/sources.list.d/influxdb.list | |
| sudo apt-get update | |
| sudo apt-get install influxdb |
For a simplistic setup, open /etc/influxdb/influxdb.conf and enable the http endpoint, the bind-address and set auth-enabled to false:
This file contains bidirectional Unicode text that may be interpreted or compiled differently than what appears below. To review, open the file in an editor that reveals hidden Unicode characters.
Learn more about bidirectional Unicode characters
| [http] | |
| # Determines whether HTTP endpoint is enabled. | |
| enabled = true | |
| # The bind address used by the HTTP service. | |
| bind-address = ":8086" | |
| # Determines whether user authentication is enabled over HTTP/HTTPS. | |
| auth-enabled = false |
Then restart the influxd service with: sudo service influxd restart
Test that your installation and configuration work by using the influx command and try out the InfluxDB example described above.
Grafana
Grafana also needs an additional apt-source for the installation on Raspberry Pi with Raspbian. See this wiki for instructions:
https://github.com/fg2it/grafana-on-raspberry/wiki#update-your-apt-source
Then install Grafana with:
sudo apt-get update
sudo apt-get install grafana
The Grafana configuration file is /etc/grafana/grafana.ini. You need to enable http as protocol and set a port to use in this file.
This file contains bidirectional Unicode text that may be interpreted or compiled differently than what appears below. To review, open the file in an editor that reveals hidden Unicode characters.
Learn more about bidirectional Unicode characters
| [server] | |
| # Protocol (http, https, socket) | |
| protocol = http | |
| # The ip address to bind to, empty will bind to all interfaces | |
| ;http_addr = | |
| # The http port to use | |
| http_port = 3000 |
After modifying grafana.ini, use sudo service grafana-server restart to apply your settings to the service.
You should now be able to login to Grafana on http://<IP ADDRESS OF RPI>:3000 with the default user admin/admin.
For more configuration options, see http://docs.grafana.org/installation/configuration/
Integration with my existing system
As mentioned in the introduction, all sensor data from my IoT-nodes are transformed to MQTT messages that are published to a locally hosted mosquitto broker.
Integrating InfluxDB is as simple as adding an additional MQTT subscriber that takes a received sensor message and store it as a value in an InfluxDB database. I use a Python 3 script (as a service) with paho-mqtt for subscribing to MQTT topics and the influxdb-python library for writing the values to the InfluxDB database. See these links on how to install the required Python libraries:
For Python 3.* you can use pip3 for installation:
pip3 install influxdb
pip3 paho-mqtt
I use the MQTT topic as measurement type for the data. This lets me get for example “Home/Outdoor/Temperature” as a time series from InfluxDB. In this implementation I set the time property of the data that is uploaded (have to use UTC-time!). If the time property was excluded, InfluxDB would have created a time stamp from the current time.
This file contains bidirectional Unicode text that may be interpreted or compiled differently than what appears below. To review, open the file in an editor that reveals hidden Unicode characters.
Learn more about bidirectional Unicode characters
| #!/usr/bin/env python3 | |
| import paho.mqtt.client as mqtt | |
| import datetime | |
| import time | |
| from influxdb import InfluxDBClient | |
| def on_connect(client, userdata, flags, rc): | |
| print("Connected with result code "+str(rc)) | |
| client.subscribe("Home/#") | |
| def on_message(client, userdata, msg): | |
| print("Received a message on topic: " + msg.topic) | |
| # Use utc as timestamp | |
| receiveTime=datetime.datetime.utcnow() | |
| message=msg.payload.decode("utf-8") | |
| isfloatValue=False | |
| try: | |
| # Convert the string to a float so that it is stored as a number and not a string in the database | |
| val = float(message) | |
| isfloatValue=True | |
| except: | |
| print("Could not convert " + message + " to a float value") | |
| isfloatValue=False | |
| if isfloatValue: | |
| print(str(receiveTime) + ": " + msg.topic + " " + str(val)) | |
| json_body = [ | |
| { | |
| "measurement": msg.topic, | |
| "time": receiveTime, | |
| "fields": { | |
| "value": val | |
| } | |
| } | |
| ] | |
| dbclient.write_points(json_body) | |
| print("Finished writing to InfluxDB") | |
| # Set up a client for InfluxDB | |
| dbclient = InfluxDBClient('192.168.1.16', 8086, 'root', 'root', 'sensordata') | |
| # Initialize the MQTT client that should connect to the Mosquitto broker | |
| client = mqtt.Client() | |
| client.on_connect = on_connect | |
| client.on_message = on_message | |
| connOK=False | |
| while(connOK == False): | |
| try: | |
| client.connect("192.168.1.16", 1883, 60) | |
| connOK = True | |
| except: | |
| connOK = False | |
| time.sleep(2) | |
| # Blocking loop to the Mosquitto broker | |
| client.loop_forever() |
Grafana configuration
With Grafana installed, you can log in as an admin and add an InfluxDB database as a new data source where you specify the http settings for InfluxDB’s http api:
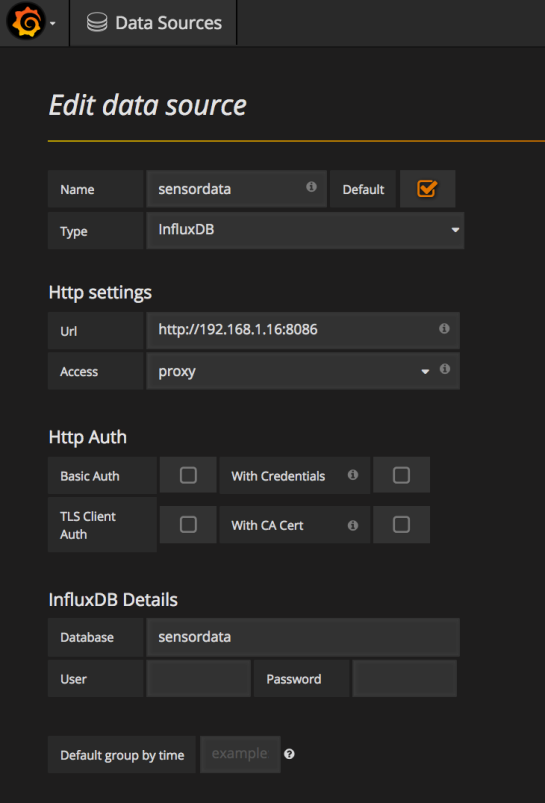
Setting the access to “proxy” (this option is called “Server” in later versions of Grafana) will make Grafana access the database from the server side. You have to use this when using Grafana outside your LAN (with port forwarding) while InfluxDB is only exposed within the LAN network. The default access is “direct” (“Browser” in later versions of Grafana), which means that the browser front end will fetch the data over http (that’s why it will not work outside your LAN unless both Grafana and InfluxDB has been port-forwarded).
With the data source defined, you can create a new dashboard that can be filled with rows and panels. On each panel you select one or several metrics from your datasource.
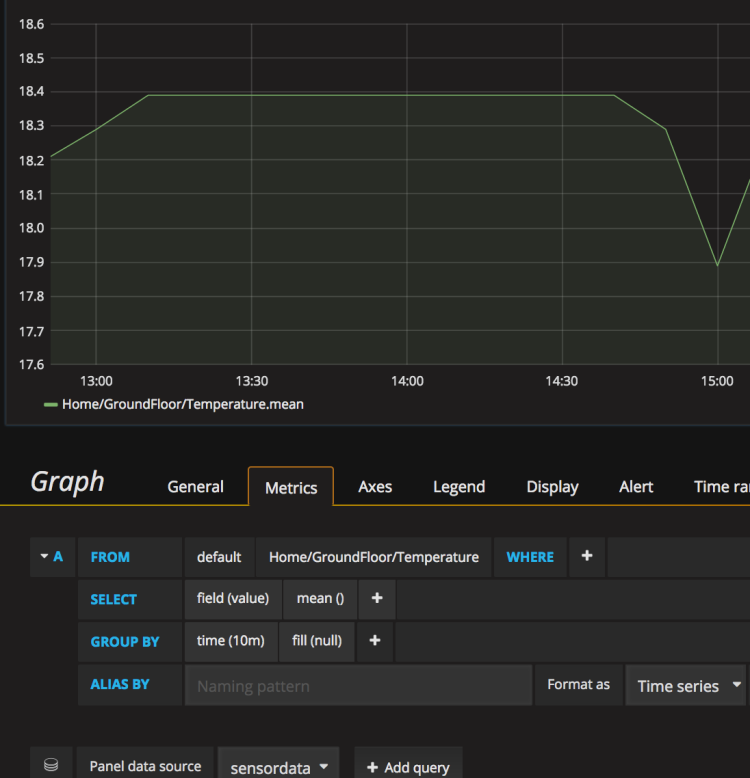
You can use the drop downs to build up the query or switch to raw mode where you write the query in plain text. Grafana is really easy to use and as the result of a change is shown immediately one can just play around with the settings to learn how it works.
For showing a momentary value, you can use the Singlestat panel:
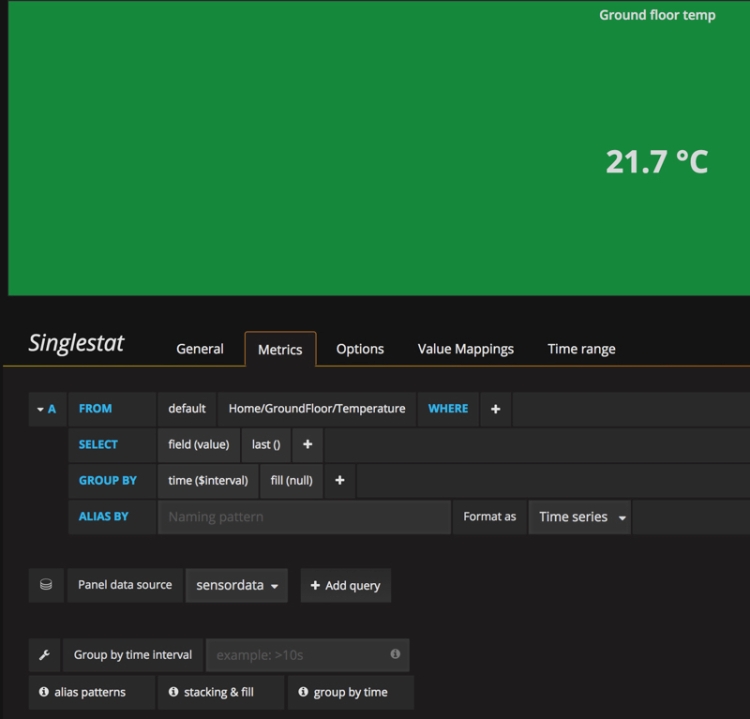
The Singlestat panel can be configured to show the last value for a time series (in the selected range). On the options tab you can select color and unit for the panel.
Results
My current main dashboard contains an overview of climate sensors and detected events (front door-opened events):

I have also added system monitoring measurements from my three Raspberry Pi:s (temperature, CPU usage, memory usage, disk usage):

Conclusions
Adapting my system to store the data as time series was easy as all data was available as MQTT topics. With the data in place in InfluxDB, connecting it to Grafana was a breeze. I’m really impressed with the ease-of-use, flexibility and performance of Grafana. I think the Grafana dashboards will be my new favourite tool for analyzing my collected data.
Both InfluxDB and Grafana works great on a Raspberry Pi without using much resources.

I am running mosquitto broker on rpi3 and python script from this article also on rpi3. It creates “dht” database in influx but it does not wirite any measurements from topic “out/#”.
InfluxDB version 1.2.2
Python 3.4
Any clues how to deal with it? 🙂
LikeLike
Hi Marcin! The script in this blog post subscribes to topics starting with “Home”, e.g. “Home/Outdoor/Value” or “Home/MyValue”. Have you modified the script to subscribe to “out/#”? What are your published MQTT topics? What values? The script only stores values that can be converted to floats. You can add additional print statements in the on_message callback function to see how far you get. Here is a Gist with more print tracing https://gist.github.com/a0ceb7c3576fd0c9018456561787377a
/Lars
LikeLike
Are the colored rectangle boxes current temperature, etc? Or the temperature for the range you selected? If the former, how do you achieve this?
LikeLike
Hi James, yes the boxes show the last value for different time series in the range specified in Grafana. I use the Singlestat panel in Grafana for this. I have updated the blog post with an example on a Singlestat panel setup. Hope this helps!
LikeLike
Thanks!
LikeLike
Have you tried automating the process where you publish the results to grafana?
LikeLike
Hi! I’m sorry, I don’t understand what you mean. Do you mean publish data from the Home Assistant database to InfluxDB (https://home-assistant.io/components/influxdb/)? No, I don’t use that. My sensors publish data via an MQTT broker and the data is stored directly in InfluxDB by an MQTT subscriber. The data is thus immediately available in Grafana.
LikeLike
Great post. It will take me a bit to understand it all but all the installs went off without any problems. I’m using a MySensors system and feeding the data to MQTT. If anyone out there is using MySensors and has this working please post how you made it work. Thanks again.
LikeLike
please add that you should use: “echo “deb https://dl.bintray.com/fg2it/deb jessie main” | sudo tee -a /etc/apt/sources.list.d/grafana.list” for RPI1, and thanks for this great information’s !
LikeLike
Thanks for the feedback! I’ve made an update with a link to the grafana-on-raspberry-wiki that has information on installations for RPI 1 and also for Raspbian versions other than Jessie.
LikeLike
Grat Post!
I have an error when I run the script:
client.loop_forever()
File “/home/ubuntu/.local/lib/python3.5/site-packages/paho/mqtt/client.py”, line 1481, in loop_forever
rc = self.loop(timeout, max_packets)
File “/home/ubuntu/.local/lib/python3.5/site-packages/paho/mqtt/client.py”, line 1003, in loop
rc = self.loop_read(max_packets)
File “/home/ubuntu/.local/lib/python3.5/site-packages/paho/mqtt/client.py”, line 1284, in loop_read
rc = self._packet_read()
File “/home/ubuntu/.local/lib/python3.5/site-packages/paho/mqtt/client.py”, line 1849, in _packet_read
rc = self._packet_handle()
File “/home/ubuntu/.local/lib/python3.5/site-packages/paho/mqtt/client.py”, line 2311, in _packet_handle
return self._handle_connack()
File “/home/ubuntu/.local/lib/python3.5/site-packages/paho/mqtt/client.py”, line 2372, in _handle_connack
self.on_connect(self, self._userdata, flags_dict, result)
TypeError: on_connect() takes 3 positional arguments but 4 were given
Any ideas
Thank’s
LikeLike
Hi! The problem is due to that in new versions of paho-mqtt, the on_connect callback should have 4 arguments instead of 3. I had updated my Git repository previously (see this file https://github.com/LarsBergqvist/MQTT_IoT/blob/master/Subscribers/subscriber_influxdb.py) but I had not updated the gist in the blog post. I will fix that now.
LikeLike
Wow, solved!!! Thank’s
One more question…
I have a a mqtt payload like this:
{“applicationID”:”1″,”applicationName”:”BLUETENTACLES”,”deviceName”:”LCD_02″,”devEUI”:”0078eb3f3349f361″,”rxInfo”:[{“mac”:”1234567887654321″,”rssi”:-37,”loRaSNR”:9.3,”name”:”MICROCHIP”,”latitude”:46.074779299999996,”longitude”:11.1217486,”altitude”:200}],”txInfo”:{“frequency”:868300000,”dataRate”:{“modulation”:”LORA”,”bandwidth”:125,”spreadFactor”:7},”adr”:true,”codeRate”:”4/5″},”fCnt”:1,”fPort”:5,”data”:”AHMmoQFnAOICaFEDAicQBIgH9EAAxLcADkIFAiasBgEA”,”object”:{“digitalOutput”:{“6″:0},”analogInput”:{“3″:100,”5″:99},”temperatureSensor”:{“1″:22.6},”humiditySensor”:{“2″:40.5},”barometer”:{“0″:988.9},”gpsLocation”:{“4”:{“latitude”:52.128,”longitude”:5.0359,”altitude”:36.5}}}}
and i will display Temperature, pressure, humidity therefore I must modify the script.
Do you have any suggestion?
LikeLike
You can parse the payload string as a json object in Python (with json.loads) and then access the properties on this object for getting the temperature etc. I have an old script where I subscribe to Owntracks MQTT messages that comes as a json payload. It looks like this: https://github.com/LarsBergqvist/MQTT_IoT/blob/master/Subscribers/subscriber_owntracks.py
LikeLike
A efw steps are missing:
– installing python driver for influxdb
sudo apt-get install python3-influxdb
– installing python paho client
sudo pip3 install paho-mqtt (also pip3: sudo apt-get install python3-pip)
LikeLike
Hi Lars
Thank for a great post.
I have an error when running the python script. Hope you can help 🙂
Traceback (most recent call last):
File “Documents/Python scripts/house_energy_mqtt2.py”, line 5, in
from influxdb import InfluxDBClient
File “/Library/Python/2.7/site-packages/influxdb/__init__.py”, line 9, in
from .client import InfluxDBClient
File “/Library/Python/2.7/site-packages/influxdb/client.py”, line 19, in
from influxdb.line_protocol import make_lines, quote_ident, quote_literal
File “/Library/Python/2.7/site-packages/influxdb/line_protocol.py”, line 13, in
from dateutil.parser import parse
File “/Library/Python/2.7/site-packages/dateutil/parser/__init__.py”, line 2, in
from ._parser import parse, parser, parserinfo
File “/Library/Python/2.7/site-packages/dateutil/parser/_parser.py”, line 50, in
from .. import tz
File “/Library/Python/2.7/site-packages/dateutil/tz/__init__.py”, line 1, in
from .tz import *
File “/Library/Python/2.7/site-packages/dateutil/tz/tz.py”, line 19, in
from six.moves import _thread
ImportError: cannot import name _thread
Im running on a OS X El Capitain
LikeLike
Hi Peter! Sorry, I can’t help you with this one. I’m running on RaspberryPi and I have not seen this issue. It looks that there is some problem with the dateutil python package on your Mac. Maybe you can search for “python dateutil ImportError: cannot import name _thread” and check for similar problems.
LikeLike
Hi Lars,
With the most recent HASSBIAN on a raspi 3B+ (image_2018-06-23-Hassbian.zip)
Distributor ID: Raspbian
Description: Raspbian GNU/Linux 9.4 (stretch)
Release: 9.4
Codename: stretch
Regarding the influxdb installation I found
apt-transport-https is already installed!
sudo apt-get install influxdb
does not install the influx binary, so you need to run
sudo apt-get install influxdb-client
This is sufficient for influxdb, no need to edit /etc/influxdb/influxdb.conf.
Cheers!
LikeLike
influxdb as installed by my previous post is still the 1.0.2 version – unfortunately.
Strangely enough – if you select “stretch stable” in the repository the 1.6.1 version is installed but
the post install script for starting the service fails.
The “jessie stable” installs correctly with the recent HASSBIAN and the service is started.
LikeLike
From the instruction to install influxdb from repository:
curl -sL https://repos.influxdata.com/influxdb.key | sudo apt-key add – source /etc/os-release
the “source /etc/os-release” does not belong there and should be removed.
LikeLike
Thanks for your comments and corrections. I made this blog post more than a year ago with Raspbian Jessie. I have now updated the installation parts with information for Raspbian Stretch.
LikeLike
Regarding the failed install of influxdb under stretch stable & fixing it:
Starting the influxdb (1.6.4-1) service fails because the unit file is masked.
After unmasking with “sudo systemctl unmask influxdb.service”
the service can be started as usual: “sudo service influxdb start”
LikeLike