
In my previous post I outlined the development of a web app that uses the Open API from Swedish Radio for working with channels, programs and episodes. That API also provides traffic message information and this blog post describes a separate web app for working with this data and using OpenLayers for displaying the traffic information on a map with OpenStreetMap. A demo of the application is available at https://larsbergqvist.github.io/sr-traffic/ and the source code can be fetched from GitHub.
The traffic information API
The traffic information API from Swedish Radio returns messages with information on current traffic disruptions in Sweden for roads and public transports. Each message is tagged with location, priority, category and some other details. You can fetch a paged message collection for the whole country or fetch the messages for a particular geographical area.
OpenLayers
I’ve used the Google Maps API for geolocation data in some previous projects. This is an easy-to-use API, but as you do need to provide an API-key when accessing it, it is a bit cumbersome to include in open-source projects. You have to put restrictions on your API key so that it only can be used from a particular client url for example – otherwise anyone can use the key that is connected to your billing account. So I started looking for alternatives and ended up with OpenLayers.
OpenLayers is an open-source library for displaying maps in web browsers. You can use different data providers for the map data and there is a free map layer based on OpenStreetMap that I use in my application.
To start using OpenLayers in an Angular application, you need to add the ol-package. To get the corresponding TypeScript type information, you can add @types/ol as a dev-dependency:
The application idea
I wanted to make a mobile-friendly web application where you can list all current traffic disruptions for a selected area in Sweden. It should be possible to fetch the user’s position from the browser and use this position to automatically select the nearest traffic area. If the user’s position is available, the distance to each traffic disruption should be calculated and displayed.
The traffic messages should be possible to sort and filter in different ways. For example, displaying the nearest disruptions at the top of the list and only showing disruptions that occurred today.
Each traffic message should contain a link so that the location of the traffic disruption can be viewed in a map. It should also be possible to show the locations of all filtered messages in the same map view.
Within the map view, you should be able to click on a marker to display the details of the traffic message.
The UI
Warning: Swedish ahead! 🙂 As the traffic message data that I use is delivered in Swedish, the application UI is Swedish-only and the screenshots below are presented in Swedish.
When you load the page, you are presented with a screen where you can select a traffic area manually of fetch the closest traffic area based on your position:

Once a traffic area has been selected, all current traffic messages for that area are fetched and presented as a list:

You can click on a traffic message to open a sidebar with a map that shows the location of this particular disruption:

You can also select “View all” to show all messages on a map:

The map is interactive so you can pinch to affect zooming & rotation and drag to scroll. You can also click/touch a marker to see the detailed traffic information for that marker:

In the traffic area drop-down control, you can choose ‘All of Sweden’ which fetches current traffic messages for the whole country. This is useful as a snapshot of the current road disruption state for Sweden:

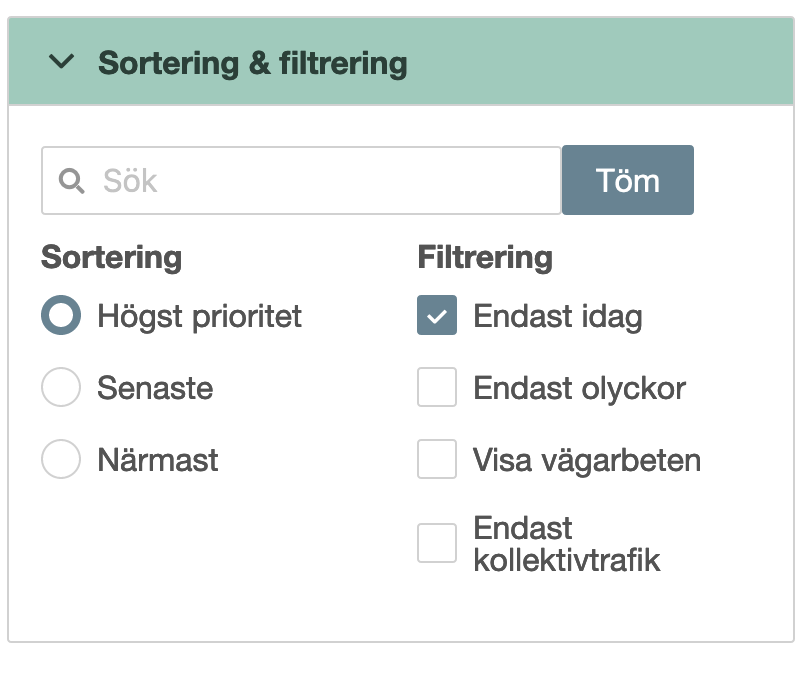
There is an accordion control that contains a section where you can change the sorting and filtering of messages:
The code
The app is based on Angular and uses the PrimeNG-library for some UI-controls. PrimeNG supports Google Maps, but as I want to use OpenLayers, I’ve made a custom MapComponent.
The html-template for the MapComponent is simple. There is a div-element that the OpenLayers map object will be attached to and a separate div-element where the attributions for OpenStreetMap will be shown (the attribution will be overlayed on the actual map otherwise, which is annoying):
There is a MapComponent class that handles the map and the markers on the map. The initializeMap() method is called when the map is created. It creates a new OpenLayers Map object and attaches a TileLayer that contains the OpenStreetMap map. There are two vector layers, one for showing markers for traffic message locations and one separate layer for displaying the position of the user. The initializeMap() method creates placeholders for markers/Features that will be styled as geometric objects when the MapComponent receives data.
Data to the MapComponent is provided by its parent as a MapInput object. This object contains a collection of marker positions and optionally a user position. This data is used for modifying the marker/feature placeholders on the map.
There is a set of helper functions in map-functions.ts that provide styling of the markers depending on their state. There is a helper function setupMarkerClickHandler that sees to that we can act on clicks on Feature objects in the message marker VectorLayer.
Last words
There’s much more to say about the code for this application but I’m running out of space in this blog post. Head over to GitHub and fetch the source yourself:
